
Equity analysis for US and Nordic markets.
mScreener is an analysis and education tool for US and Nordic listed equities. It does not give recommendations and it does not trade.
Every name, and the reason it is there.
The output is a list of names that currently meet the criteria, a list of names that do not, and the reason for each exclusion.
What it does
- Applies the same documented criteria to every stock in the universe.
- Presents the results in a consistent, reviewable order.
- Shows the rejection reason for every stock that fails.
- Keeps a watchlist and a journal for your own notes.
What it does not do
- It does not predict prices or rank stocks by expected return.
- It does not place orders or connect to a broker.
- It is not tuned to recent results.
- It is not investment advice and it is not personalised.
Who it is for
- People who want to study market structure with a consistent lens.
- People who prefer to see why a stock failed, not only which passed.
- People who do their own analysis and want a repeatable starting point.
What a daily session looks like.
Choose a market
US or Nordic. Each market has its own universe and configuration.
Read the result tables
Stocks that passed are listed with the values that were checked. Each row links to a chart.
Review the rejections
Every name that failed is listed with its reason. This is where most of the learning happens.
Keep your own record
Add names to a watchlist and write journal notes. Nothing is executed on your behalf.
Tables, charts and reasons on one screen.
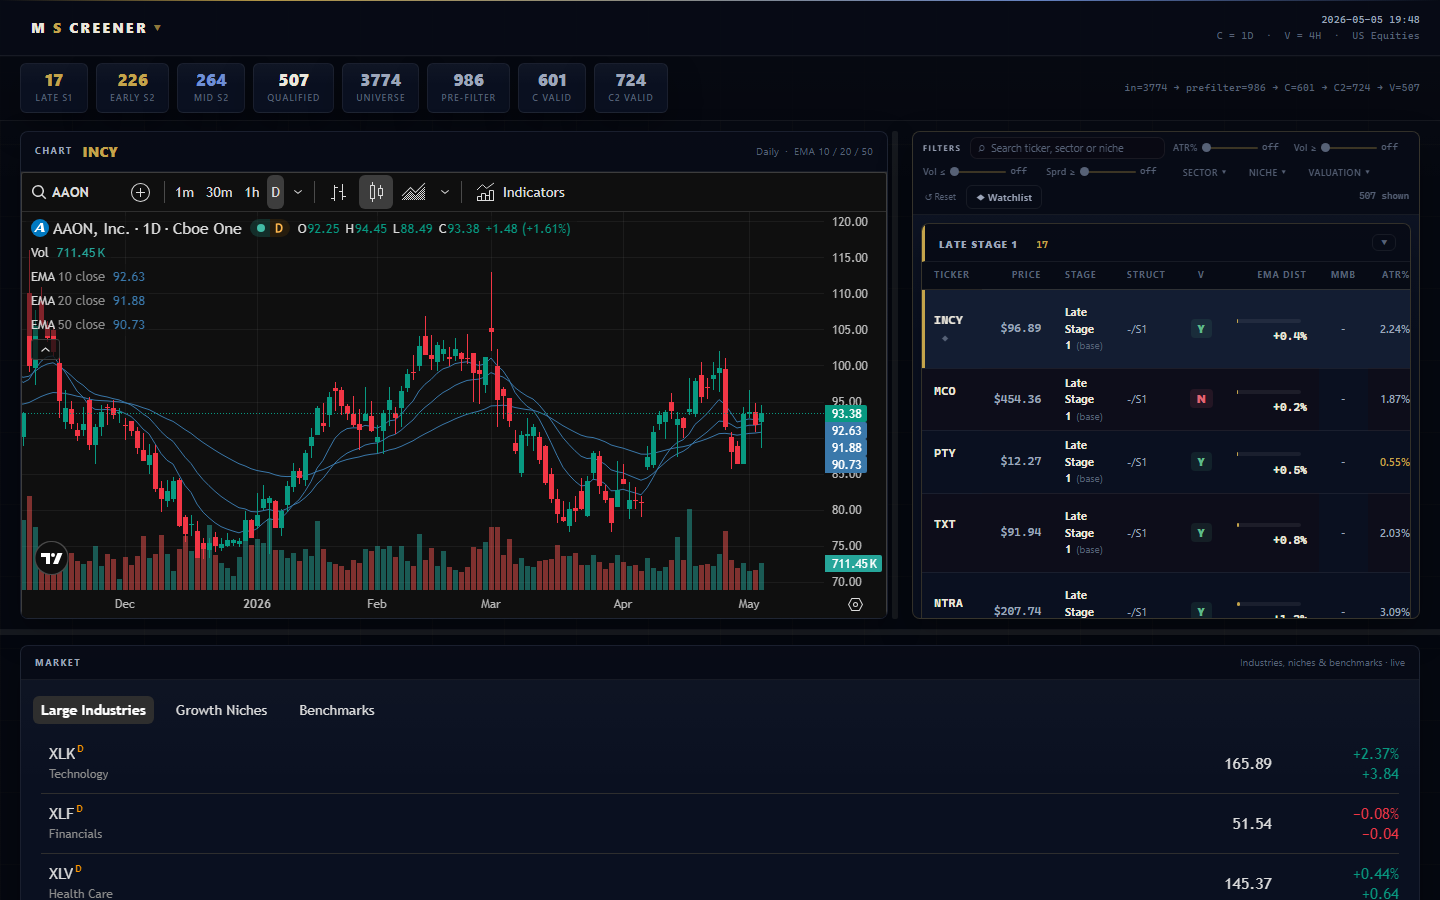
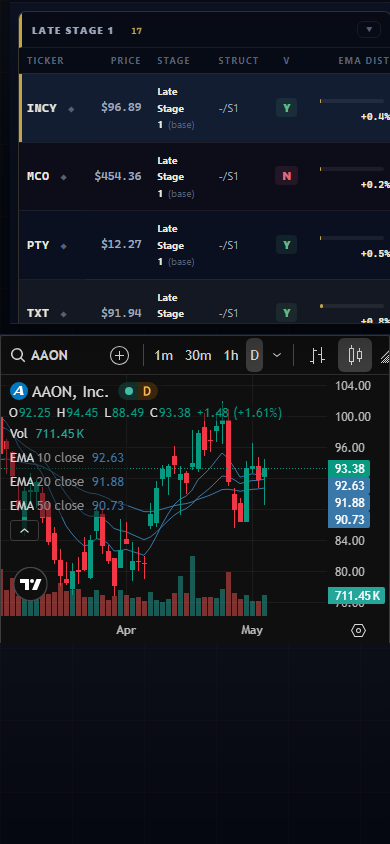
The panel is a single page per market: a chart for the selected stock, filters, the result tables and the rejection list. It works on desktop and on a phone.
What runs, and what is stored.
- Market dataDaily end-of-day price and volume data for the listed universes. Results are computed once per trading day and published as static pages.
- ChartsCharts inside the panel are provided by TradingView widgets, which load from TradingView's servers when you open a chart.
- Third parties on this pageGoogle Fonts is the only external request on the public homepage. No analytics, no tracking pixels, no advertising scripts.
- AccountsSign-in is server-side with a session cookie. Passwords are stored hashed. Your theme choice is kept in a cookie and, when signed in, on your account.
- TransportHTTPS only, with HSTS and a strict content security policy.